
Ontology for Satellite Image Classification (SOLERES KRS)
Introduction
UML Class Diagram
Satellite Image Modelling
Satellite Image Classification Modelling
Model Transformation Process
OWL/XML Ontology
SOLERES-KRS is the part of the SOLERES project that models
environmental information. Modelled environmental information is linked
to satellite image classification. The aim of satellite image
classification is to divide image pixels into discrete classes
(spectral classes). The resulting classified image is a thematic map of
the original image essentially. Figure shows the classification process
.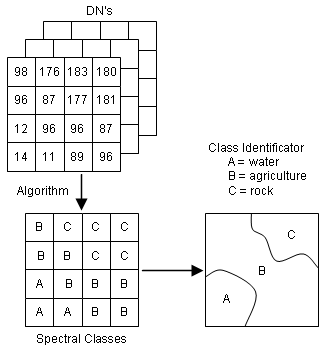
Figure 1. Classification process.
Figure shows the UML class diagram of a satellite image
classification modelled partially. The concepts are basically grouped
into two parts: (a) the concepts that identify the satellite image
information (Satellite_image class) and; (b) the concepts that
identify the process of an image classification (Image_classification
class).
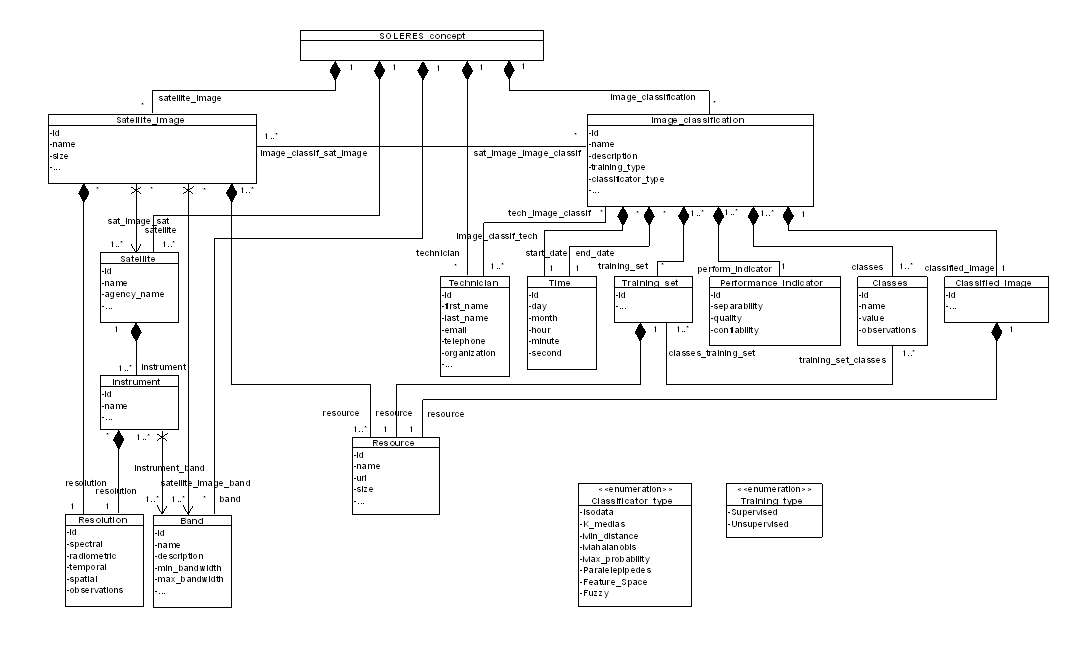
Figure 2. UML Class Diagram. Click to enlarge
A satellite image is obtained by means of a satellite (remote
sensing). This information is modelled in the diagram by the Satellite
class, and it includes properties like its name and the agency’s name,
among others. In addition, a satellite uses a set of instruments or
sensors (Instrument class) to obtain the satellite image in a
certain resolution (Resolution class) and by using a set of
bands (Band class). The resolution describes the spectral,
radiometric, temporary and spatial information of an image. The same
band of a satellite image can be got by different instruments. Finally,
every satellite image can be physically stored as an external link in a
set of files, identified in the Resource class.
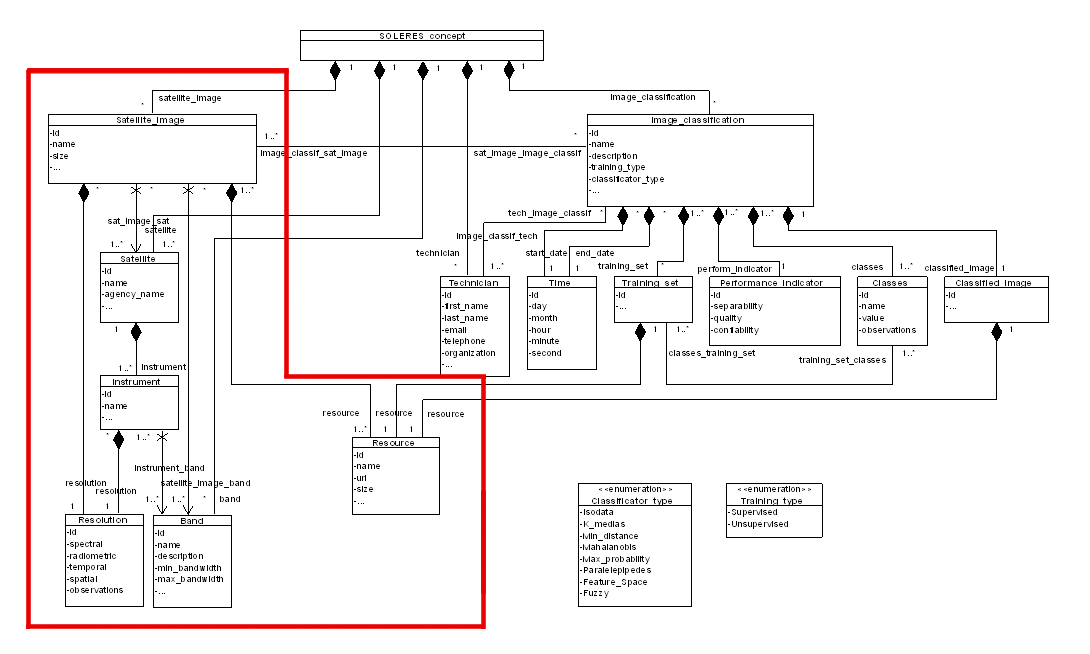
Figure 3. Satellite Image Modelling. Click to enlarge
Satellite Image Classification Modelling
We represent the concepts that are associated with the information of an image classification, grouped into the Image_classification class. A classification is made by some technicians (Technician class) in some specific time (Time class) and it uses a training set (Training_set class) and a performance indicator evaluation method (Performance_indicator class) to obtain classes (Classes class) that generate the classified image (Classified_image class). Both of them, training set and classified image, are stored in files, too.
There are other evaluation methods for the image classification, such as Ellipses, Histogram, Transformed divergence, Jeffries-Martusa distance, Statistical divergence. However, the evaluation method used in the SOLERES project is performance indicator. Common classification procedures can be split up into two divisions based on the method used: supervised and unsupervised classification.
There are several types of statistics-based supervised classification algorithms. Some of the most popular ones are parallelepiped, minimum distance, maximum likelihood, fuzzy supervised, neural model and Mahalanobis distance, among others. In an unsupervised classification, the analyst only specifies the number of classes, and the algorithm groups the classes, only based on the numerical information in the data. In these algorithms, the analyst does not have to know the zone to study. There are many unsupervised classification algorithms, such as Isodata, k-means, Leader, neural model unsupervised or MaxiMin. This information is identified in the UML class diagram with the Classificator_type and Training_type enumeration classes.
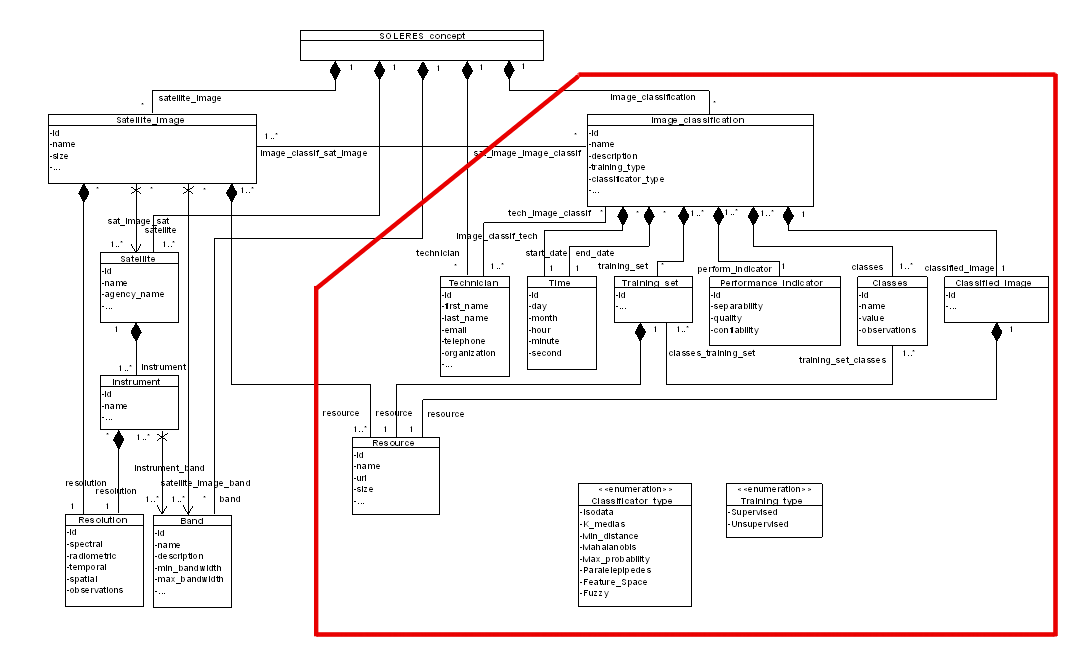
Figure 4. Satellite Image
Classification
Modelling. Click to enlarge
The ontology has been created in OWL/XML from the UML class diagram automatically. Figure shows the UML to OWL/XML transformation schema. We used the Model-Driven Engineering (MDE) perspective based on the OMG classical Model-driven Architecture (MDA). To achieve the process we used three models: the UML model, the OWL model and the OWL/XML model. The first one is used to represent the environmental image classification class diagram. The second one is generated temporarily to be able to carry out the transformation. The last one represents the OWL ontology obtained in XML format.
The model-transformation is carried out automatically in two steps: (a) in the first step, we used the UML2OWL ATL transformation to obtain an OWL model for the ontology by using the model of the UML class diagram, and; (b) in the second step, we got the XML final representation of our OWL ontology through the model obtained and the OWL2XML ATL transformation. Figure shows a piece of the OWL/XML model obtained as a result of the mapping process.
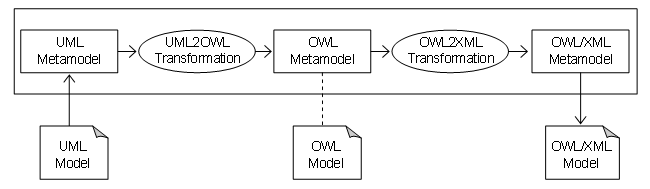
Figure 5. UML to OWL/XML
transformation
schema.
This example shows the definition of the Image_classification class. It has two parts: a reference generated automatically by the transformation process and a list of restrictions. The reference is made up of the ID element. The list of restrictions includes classification characteristics, such as id (Image_classification.id) or name (Image_classifica-tion.name) properties, and relations with instances of other classes, such as Technician (Image_classification.ima-ge_classif_tech) or Performance_indicator (Image_classification.perform_indicator). Moreover, the cardinality restriction asserts that every classification has exactly one id, one name, etc. Finally, the label element provides a readable name for the class. The definition of the other classes would be similar to this one.
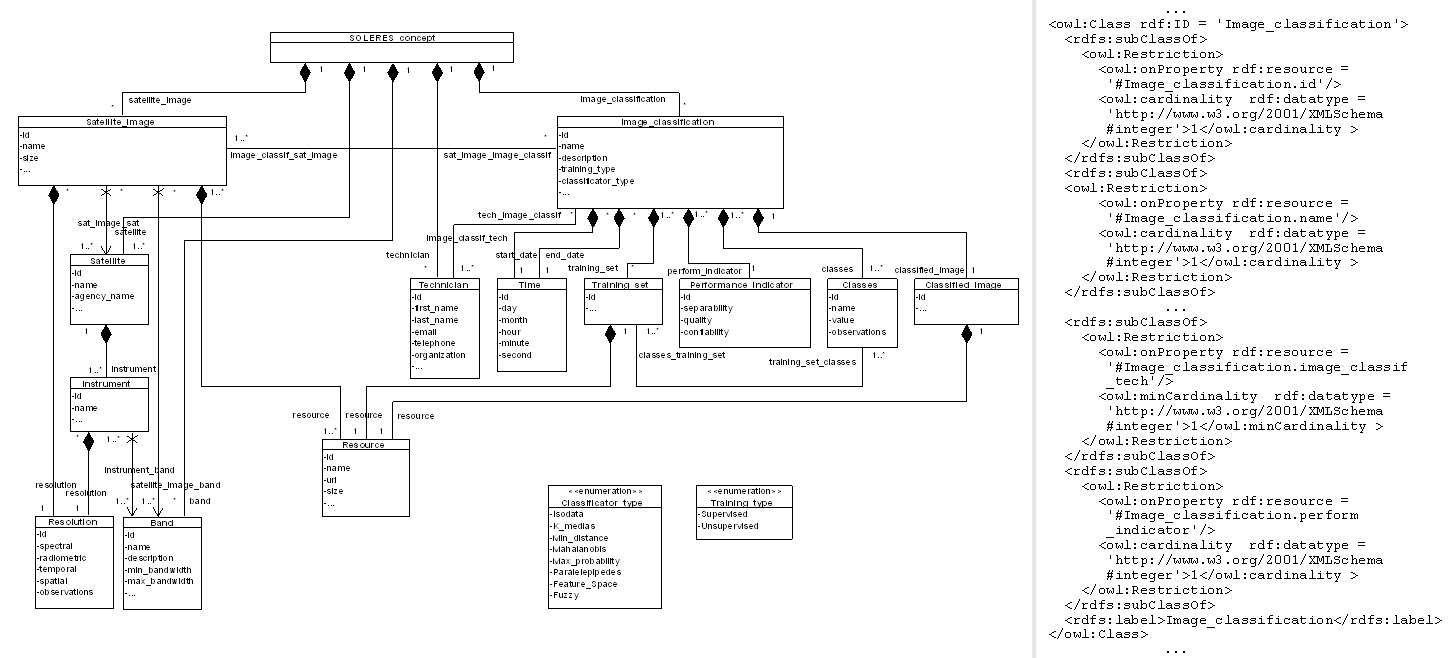
Figure 6. UML Class Diagram and a piece of the OWL/XML Ontology. Click to enlarge