3. Evaluation of light availability


3.3. The Lambert-Beer model and polychromatic light: mean absorption coefficient (ka)
In the last page we have been assuming that light is attenuated following a exponential decay law as it passes through the absorbing medium. We justified this becausem microalgae are mostly absorbing due to their high pigment content.
We also assumed that, although we are working with white (polychromatic) light we can obtain average ka values that are usable in our circumstances.
Now we will take a closer look at what are these average coefficients, how to obtain them and what deviation of the Lamber-Beer law can be expect.
-
•The extinction coefficient ka.
We have seen the extinctio coefficient before. It is a number that expresses the proportionality between absoption and irradiance (I·ka). This gave rise to the Lambert-Beer law, as we saw before:
I(x)=Io·e-ka·Cb·x
But ka can depend strongly on the wavelength of the radiation. We will rewrite qye Lambert-Beer law to highlight this:
Iλ(x)=(Iλ)o·exp(-kaλ·Cb·x)
This can be rearranged to,
-
•ka at different wavelengths:
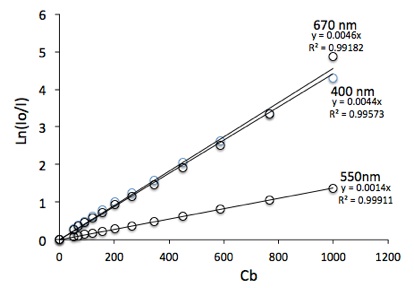
The next graph shows Ln(Io/I) vs Cb in a cuvette 1 cm thick (L=0.01 m). The experiment has been done for the microalgae Muriellopsis sp. at Cb ranging from 0 to 1000 g/m3. The measurements habe been done at different wavelenghts. Here are shown the results for 400, 550 and 670 nm to demostrate how different the ka can be.
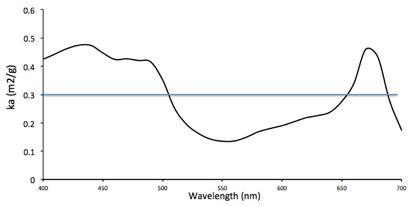
You can calculate the ka at each wavelength from the slopes of these lines. The graph below shows the ka of Muriellopsis in tne entire range of visible wavelengths (400-700 nm).
-
•Ka in polychromatic light:
The following experimental procedure allows obtaining a mean ka value to be used for a given microalgae in a specific photobiorreactor and a specific light source. The loss of generality is widely compensated by the ease of use and because the value of ka obtained compensates for other innacuracies in the light flux model as well as for the use of non-monochromatic light.
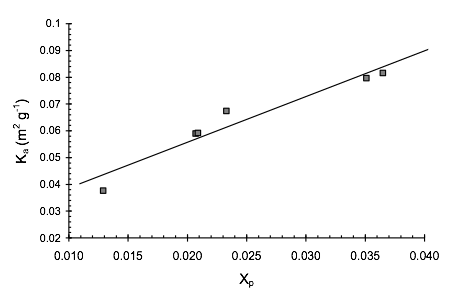
The plot placed right shows that there is a relationship between ka and the pigment content. A linear dependence is suggested.
The value of ka thus obtained is an average for the particular composition of the light used in the experiment. As the light composition changes inside the culture as the biomass concentration increases, deviations are likely to occur at higher biomass concentrations.
Questions:
-
•Discuss the differences you can think of between this experiment and the procedure carried out in spectrophotometers.
-
•Spectrophotometers usually give absorbance readings that are calculated using decimal logarithms. Discuss what the difference is between using natural or decimal logaritms.
-
•Propose a equation to obtain ka as a function of the pigment conten Xp (mass fraction) shown in the last plot.
-
•Find in the literature vaues of ka for other microalgal strains.

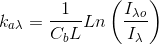

Thus, kaλ can be obtained measuring Iλ at a position inside a culture we will call L. Log(Io/I) is usually called “absorbance” but beware that absorbance is most times given in decimal logarithms and must be converted to base e if it is to be used in the Lambert-Beer law with the form we are using.
But ka is better measured by taking several mesurements of I vs Cb at a known L and plotting Loge(Io/I) vs Cb. This should be a straight line whose slope is ka·L. We will we doing this next.
The absorption of light varies with wavelenght. This means that in rigor, we should apply the equations for irradiance distribution shown in the las page for every different wavelength.
This complicates the calculations, so we are going to show that it is possible to work with a mean value of ka for polychromatic light. A mean ka for perfectly white light is shown in the graph. Its valu is 0.301 m2/g.
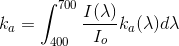
The averaging procedure must take into account the composition of the light and give more weight to the ka at wavelengths that carry a higher photon flux. A weited average a shown belog is the most appropriate.
But obtaining both the light composition and ka in all the spectrum is a tedious procedure. A working mean ka can be obtained experimentally as is described next.

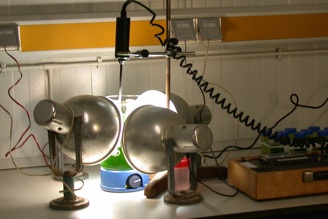
Procedure
-
•A device as similar as possible to the culture vessel is chosen. The same geometry and if possible the same size.
-
•Light source is placed as in the culture setup and the test intensity is as close as possible to the culture conditions.
-
•The sensor (4π, but we will discusse the apprpriateness of sensors in class) is placed at the center of the vessel or in a place where the light path is known and the same for all light sources.
-
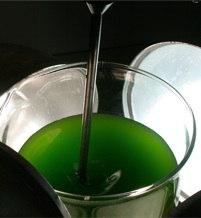
•Io is meassured placing fresh medium in the vessel.
-
•Different concentrations of biomass, Cb, in culture medium are placed in the vessel and the corresponding meassures of irradiance, I, taken.
In this way, data of irradiance vs. culture concentration is obtained (I, Cb). From this, ka can be calculated.
The procedure compensate for the change in color of the light as concentration increases and for the innacuracy in the light path. Actually, in rigour, ka·L should be used and the value of ka considered an estimation.
-
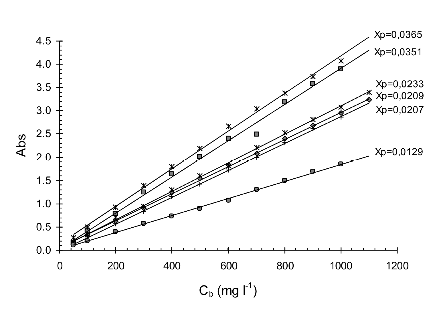
•Plots of Ln(Io/I) vs. Cb allow checking for linearity (and confirming that the Lambert-Beer law can be used in that range).
-
•The slopes of these plots are the product ka·L.
-
•Estimations of ka can be obtained thus.
The data obtained is specific to the biomass used (microalgal species or even strain) and changes with the pigment content, shown in the plot below left that shows the results obtained for the same biomass (Isochrysis galbana) with different pigment conten ranging from 1.3% to 3.6 d.wt. (chlorophyll + carotenoids).