1 - Fundamentals of microalgae-based processes.
1.2 - Stoichiometry of photosynthesis applied to PBRs
A photobioreactor is a special type of bioreactor designed for the cultivation of photosynthetic organisms — microalgae, cyanobacteria or plants — in which the energy source is not an oxidisable chemical substrate but light. Like any bioreactor, its rational design requires combining four fundamental elements:
- The stoichiometry of the process, which establishes the quantitative relationships between substrates consumed, products generated and biomass synthesised.
- A growth model describing how the growth rate depends on cultivation conditions.
- Mass balances on the biomass and on the relevant components of the culture medium.
- In the specific case of photobioreactors, the quantification of light availability inside the reactor, which plays the role of the limiting substrate balance used in conventional bioreactors.
In this section we will study the stoichiometry of the process, which in this case is photosynthesis.
- Photosynthesis is a quantum process.
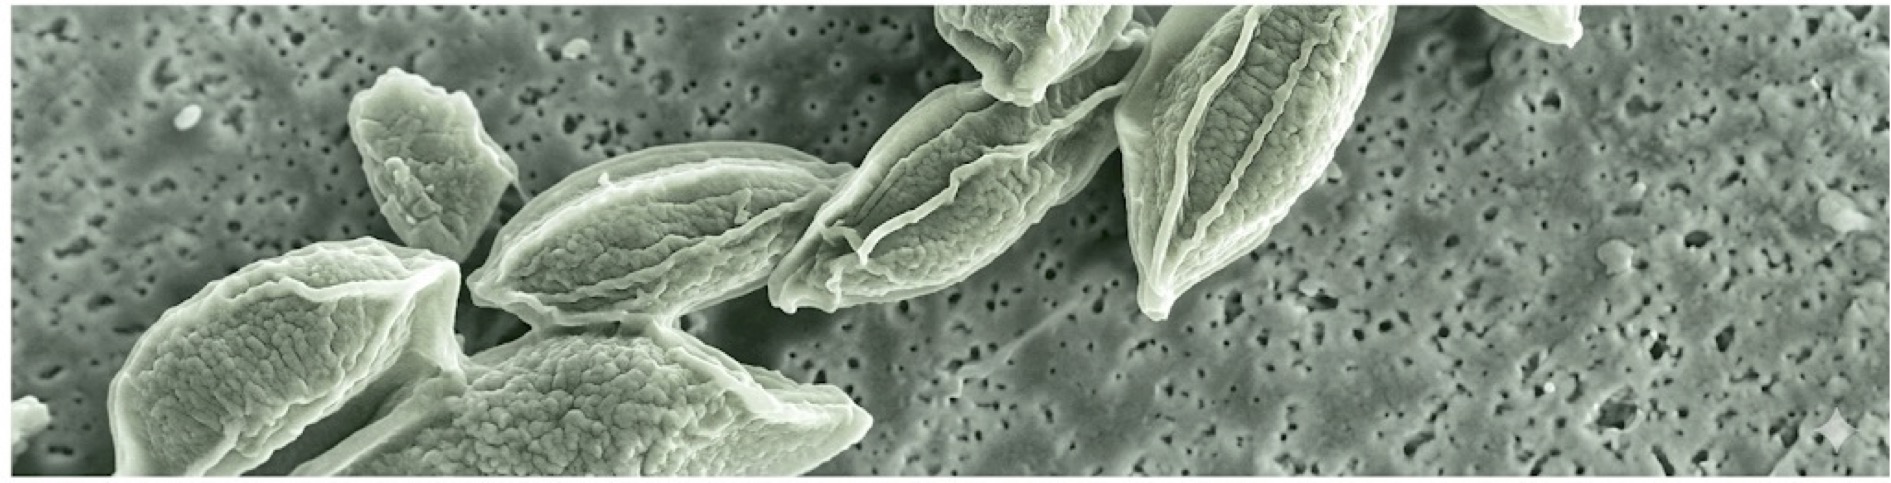
Photosynthesis begins with the impact of a photon on one of the photosystems, PSI (photosystem 1) or PSII (photosystem 2). The process has been dramatically depicted by AI in the image below:
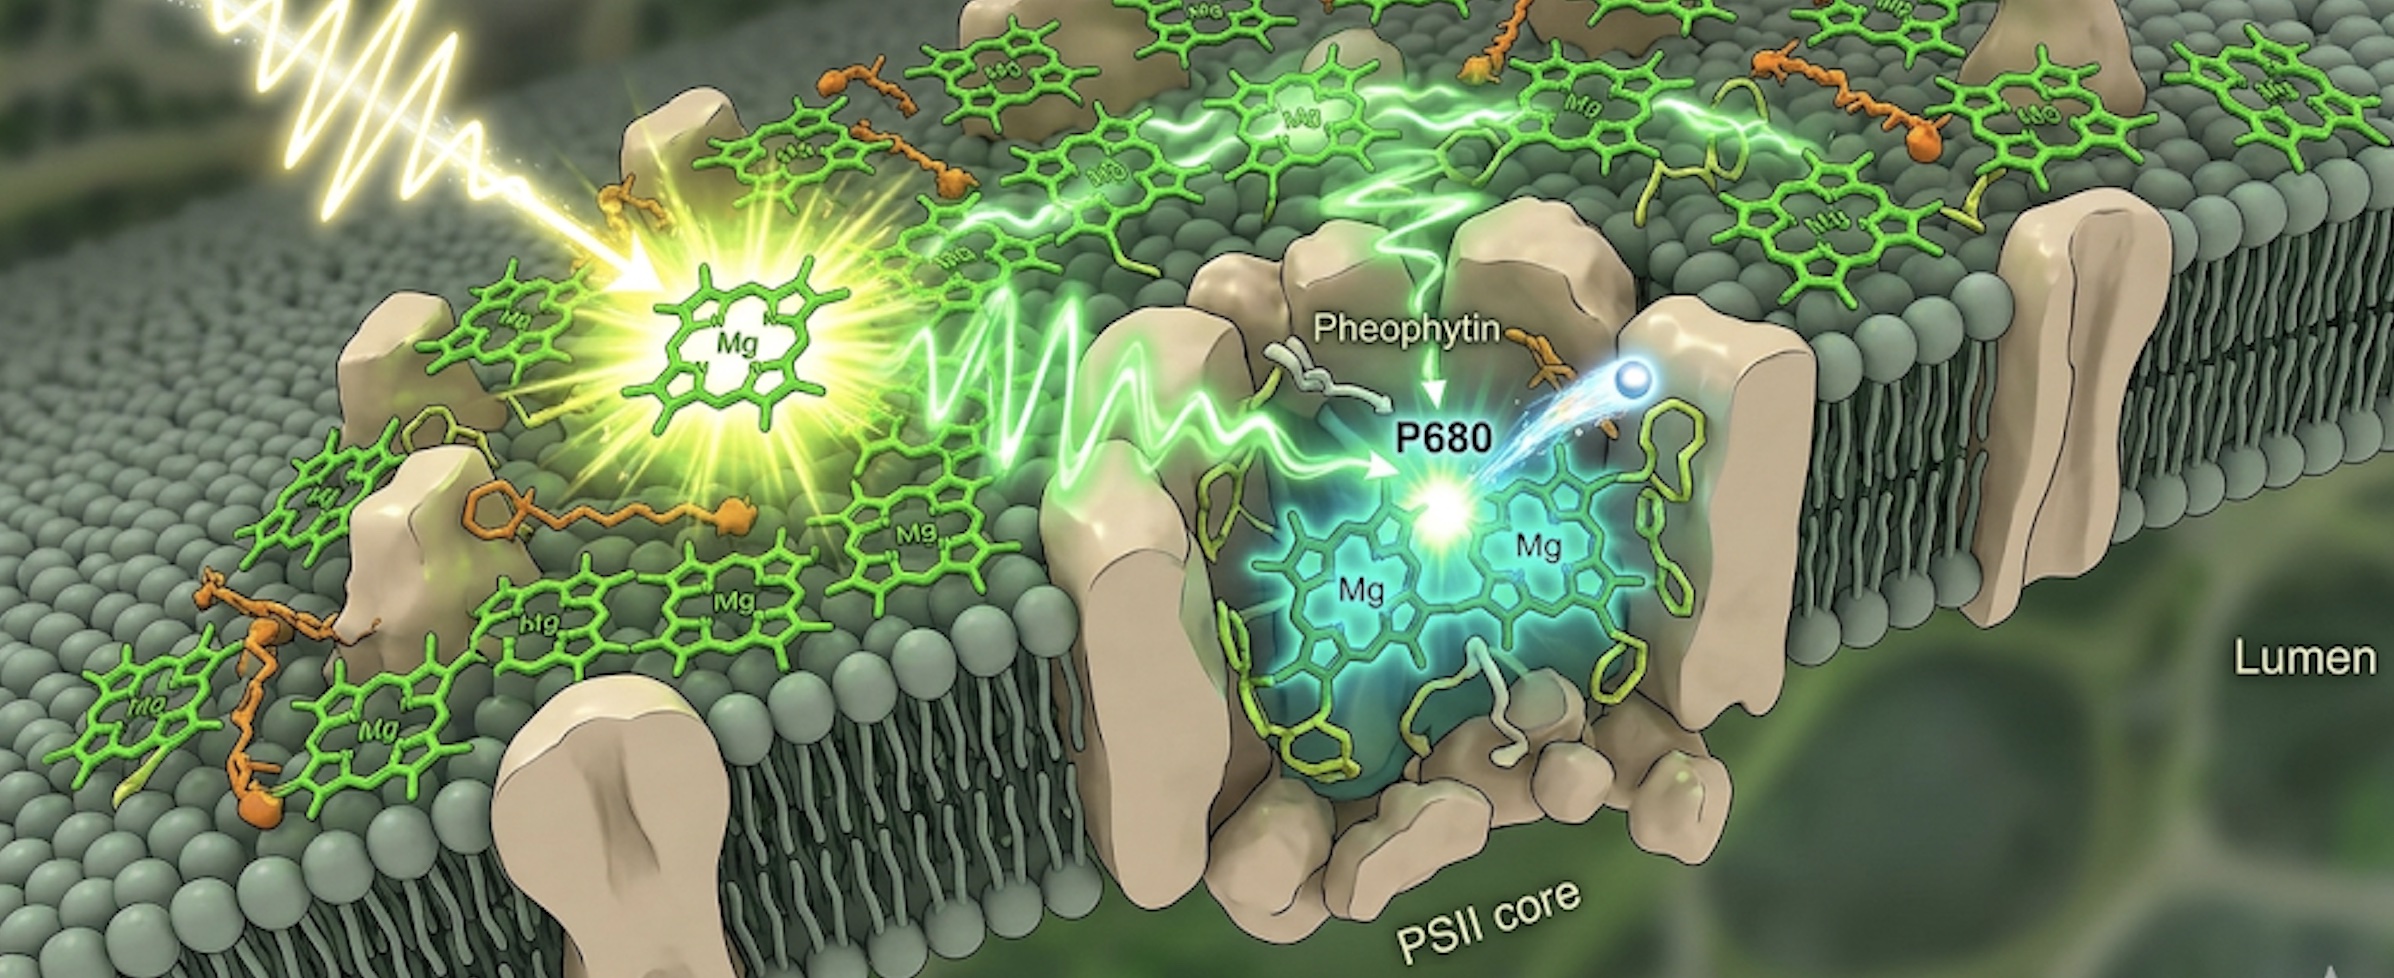
A photon strikes an antenna of a PSII and is transferred to the active centre of PSII (or, as the case may be, PSI), where it drives the photosynthesis process. But you already know this from previous courses. What we want to highlight and recall here is that 4 photons are needed to drive the splitting of two water molecules in order to release one molecule of .
Furthermore, it is important to note that the energy of the photon does not matter, as long as it falls within the PAR range (between 400 and 700 nanometres, nm). What does matter is that 4 photons are required in PSII and another four in PSI, making a total of 8 photons.
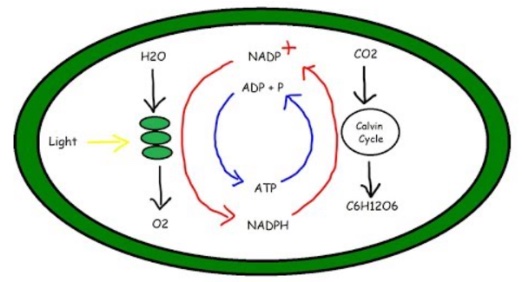
This is the so-called "light phase" of photosynthesis. What is relevant for this course is that for every 8 photons (absorbed and assimilated by the photosystems), two water molecules () are split, one molecule of oxygen () is generated, two NADPH are regenerated from two NADP+, and 3 ATP are formed from ADP (plus their corresponding phosphates). In summary, the stoichiometry of the light phase of photosynthesis is:
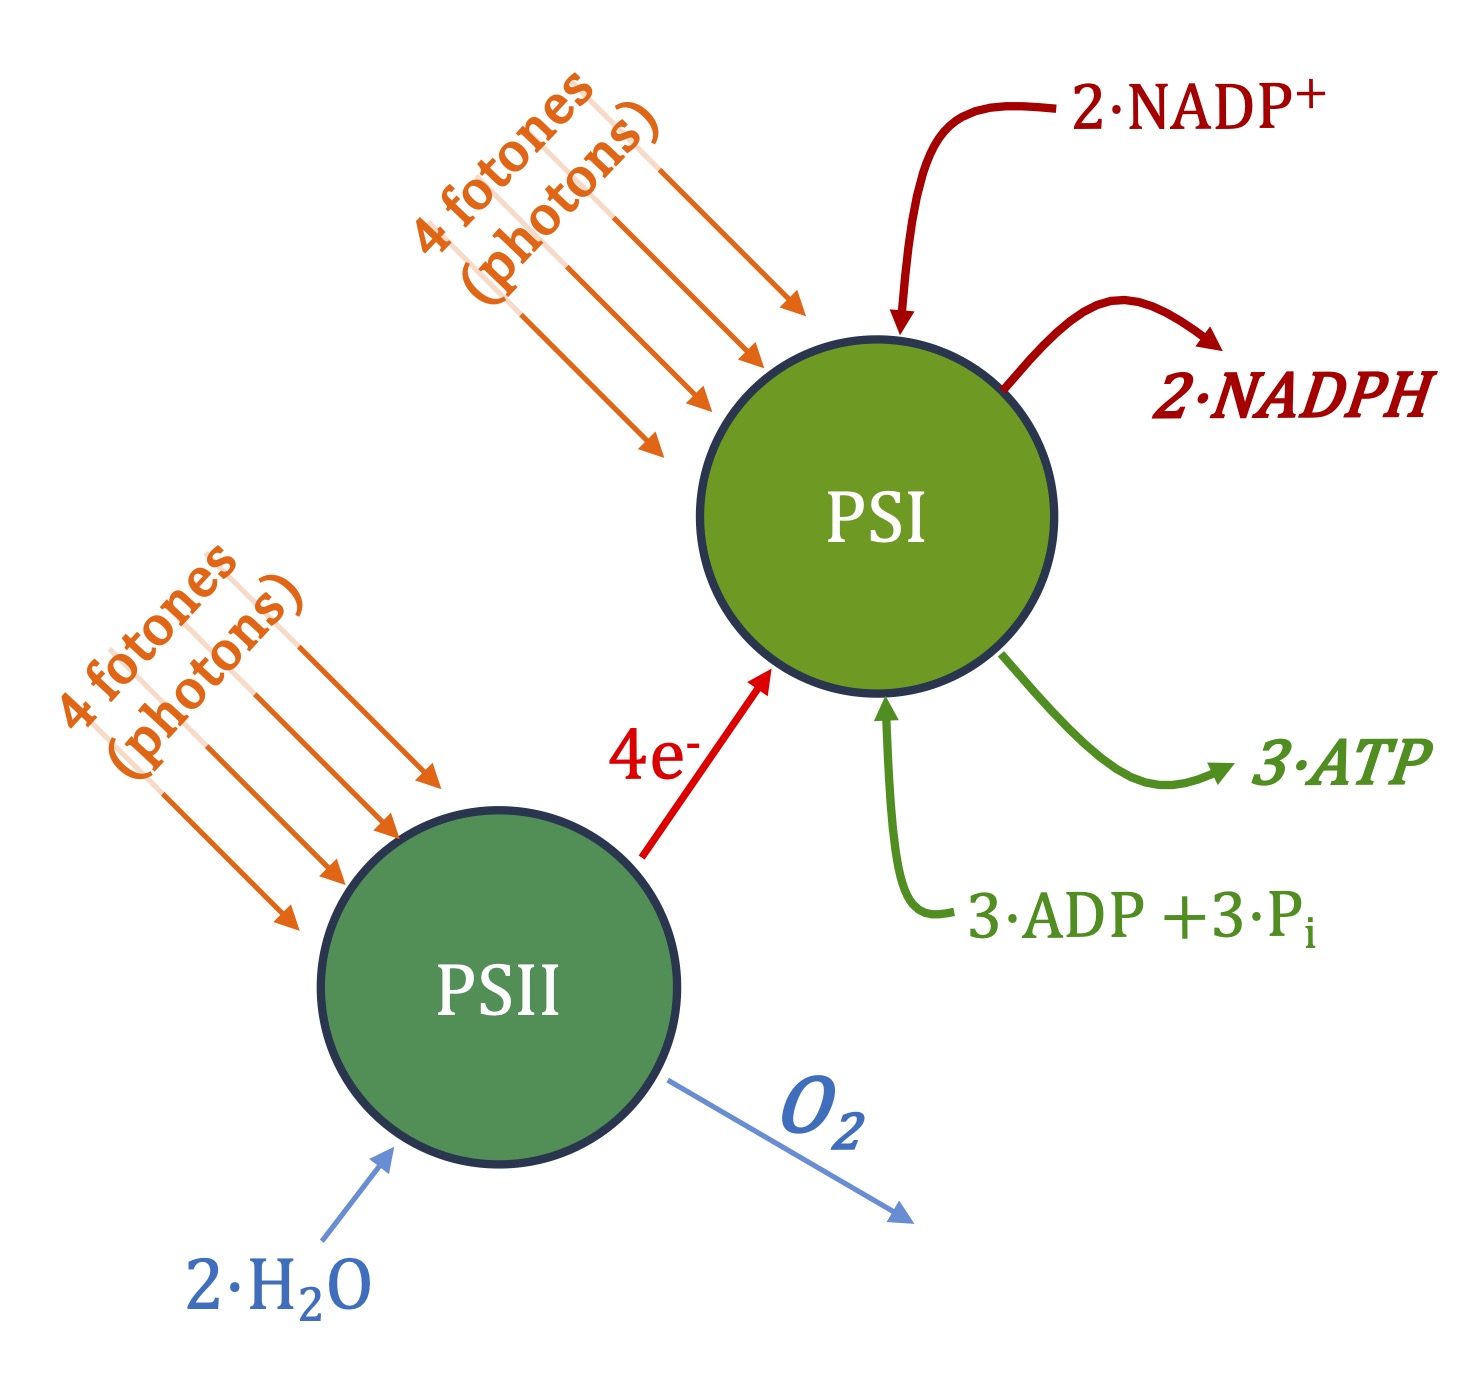
We say it is a quantum process because it is driven by the number of photons absorbed, not by the energy absorbed. It makes no difference whether they are red photons (≈171 kJ/mol) or violet photons (≈299 kJ/mol).
- Photosynthesis fixes organic carbon.
The stoichiometry of the light phase is incomplete. It tells us that for each released, 8 PAR photons have been needed. It appears that two molecules of have also been consumed, but this is not actually true because in a later phase water is generated and the net consumption is only one water molecule. The fixation of CO2, that is, its conversion into organic carbon, takes place in the Calvin-Benson cycle.
The Calvin-Benson cycle is a complex set of biochemical reactions that cannot be understood molecule by molecule. The adjacent figure shows "three turns" of the cycle, which is the minimum that can be understood.
-
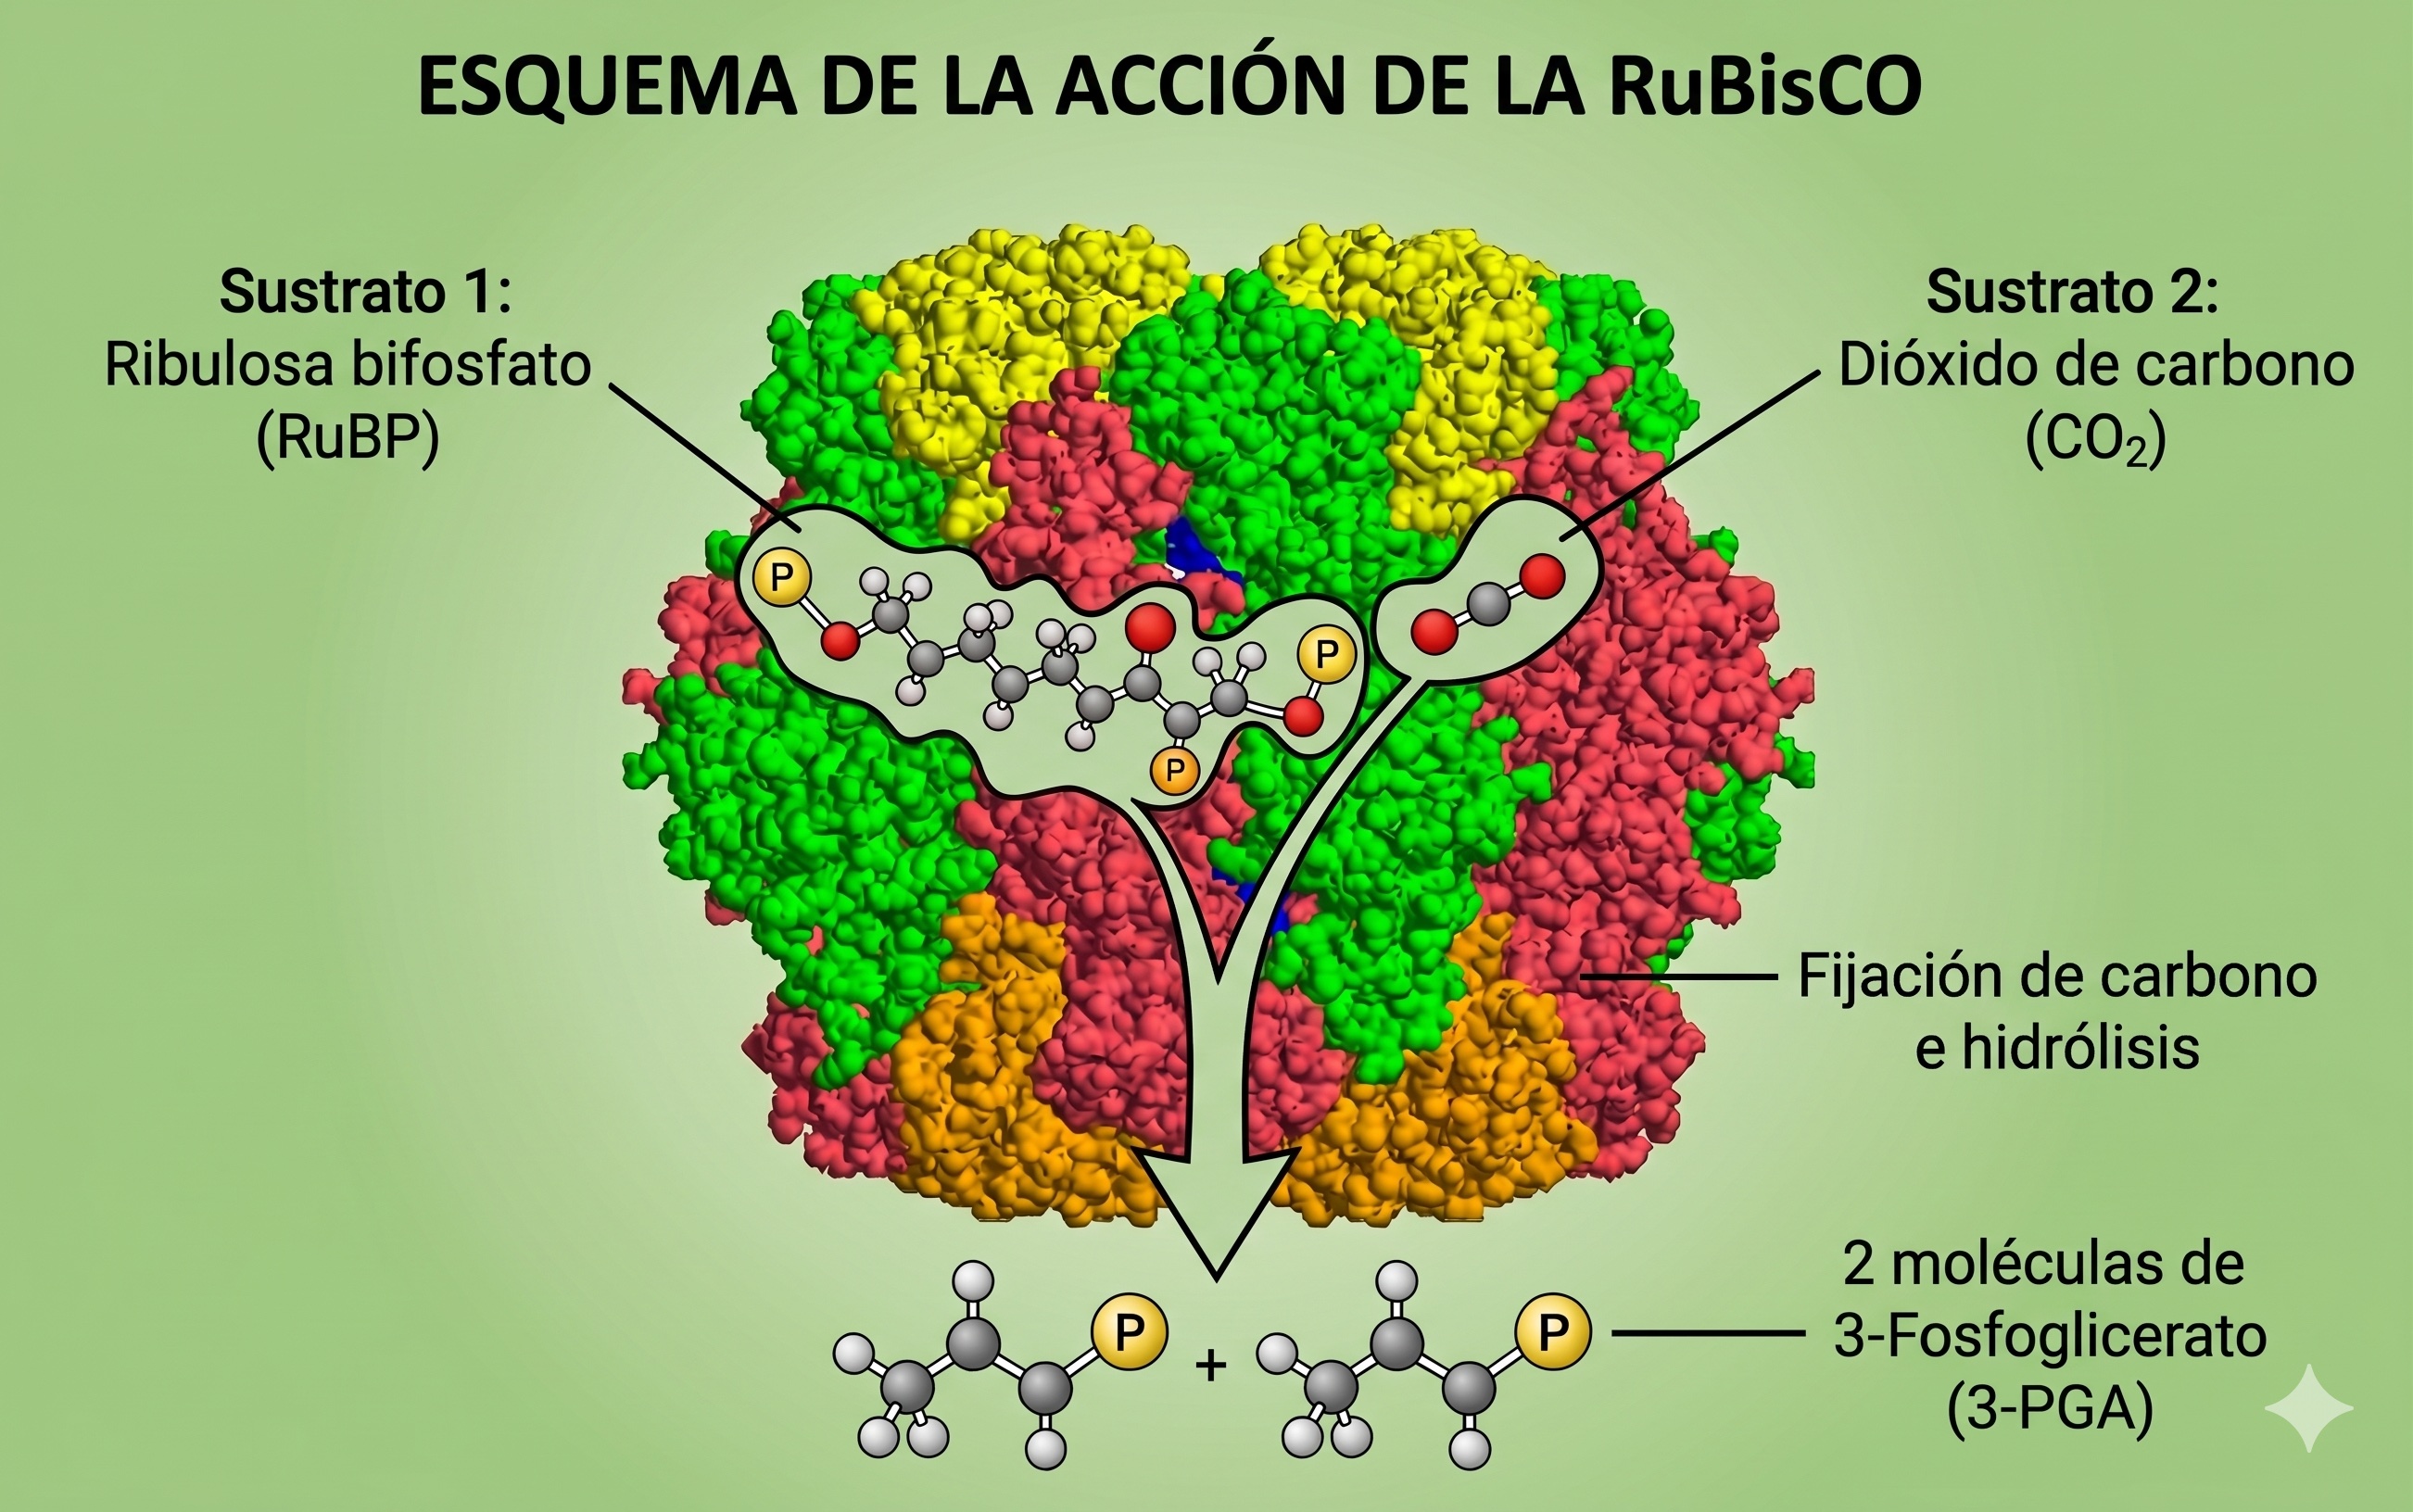
The main event of this cycle is the condensation of a five-carbon bisphosphate sugar, ribulose-1,5-bisphosphate (RuBP), with to give two molecules of 3-phosphoglycerate (3PG).
-
This step is catalysed by the enzyme RUBISCO (Ribulose-1,5-bisphosphate carboxylase), the most abundant enzyme on Earth.
-
3PG is reduced to 1,3-bisphosphoglycerate (BPG) and then to glyceraldehyde-3-phosphate (G3P). This process consumes 2 molecules of ATP and two of NADPH per carbon atom fixed.
-
Finally, RuBP is regenerated from part of the G3P. This process consumes another ATP per carbon atom fixed.
The net result is that each organic carbon atom that appears requires 3 ATPs and two NADPHs — the same as those formed in the light phase.
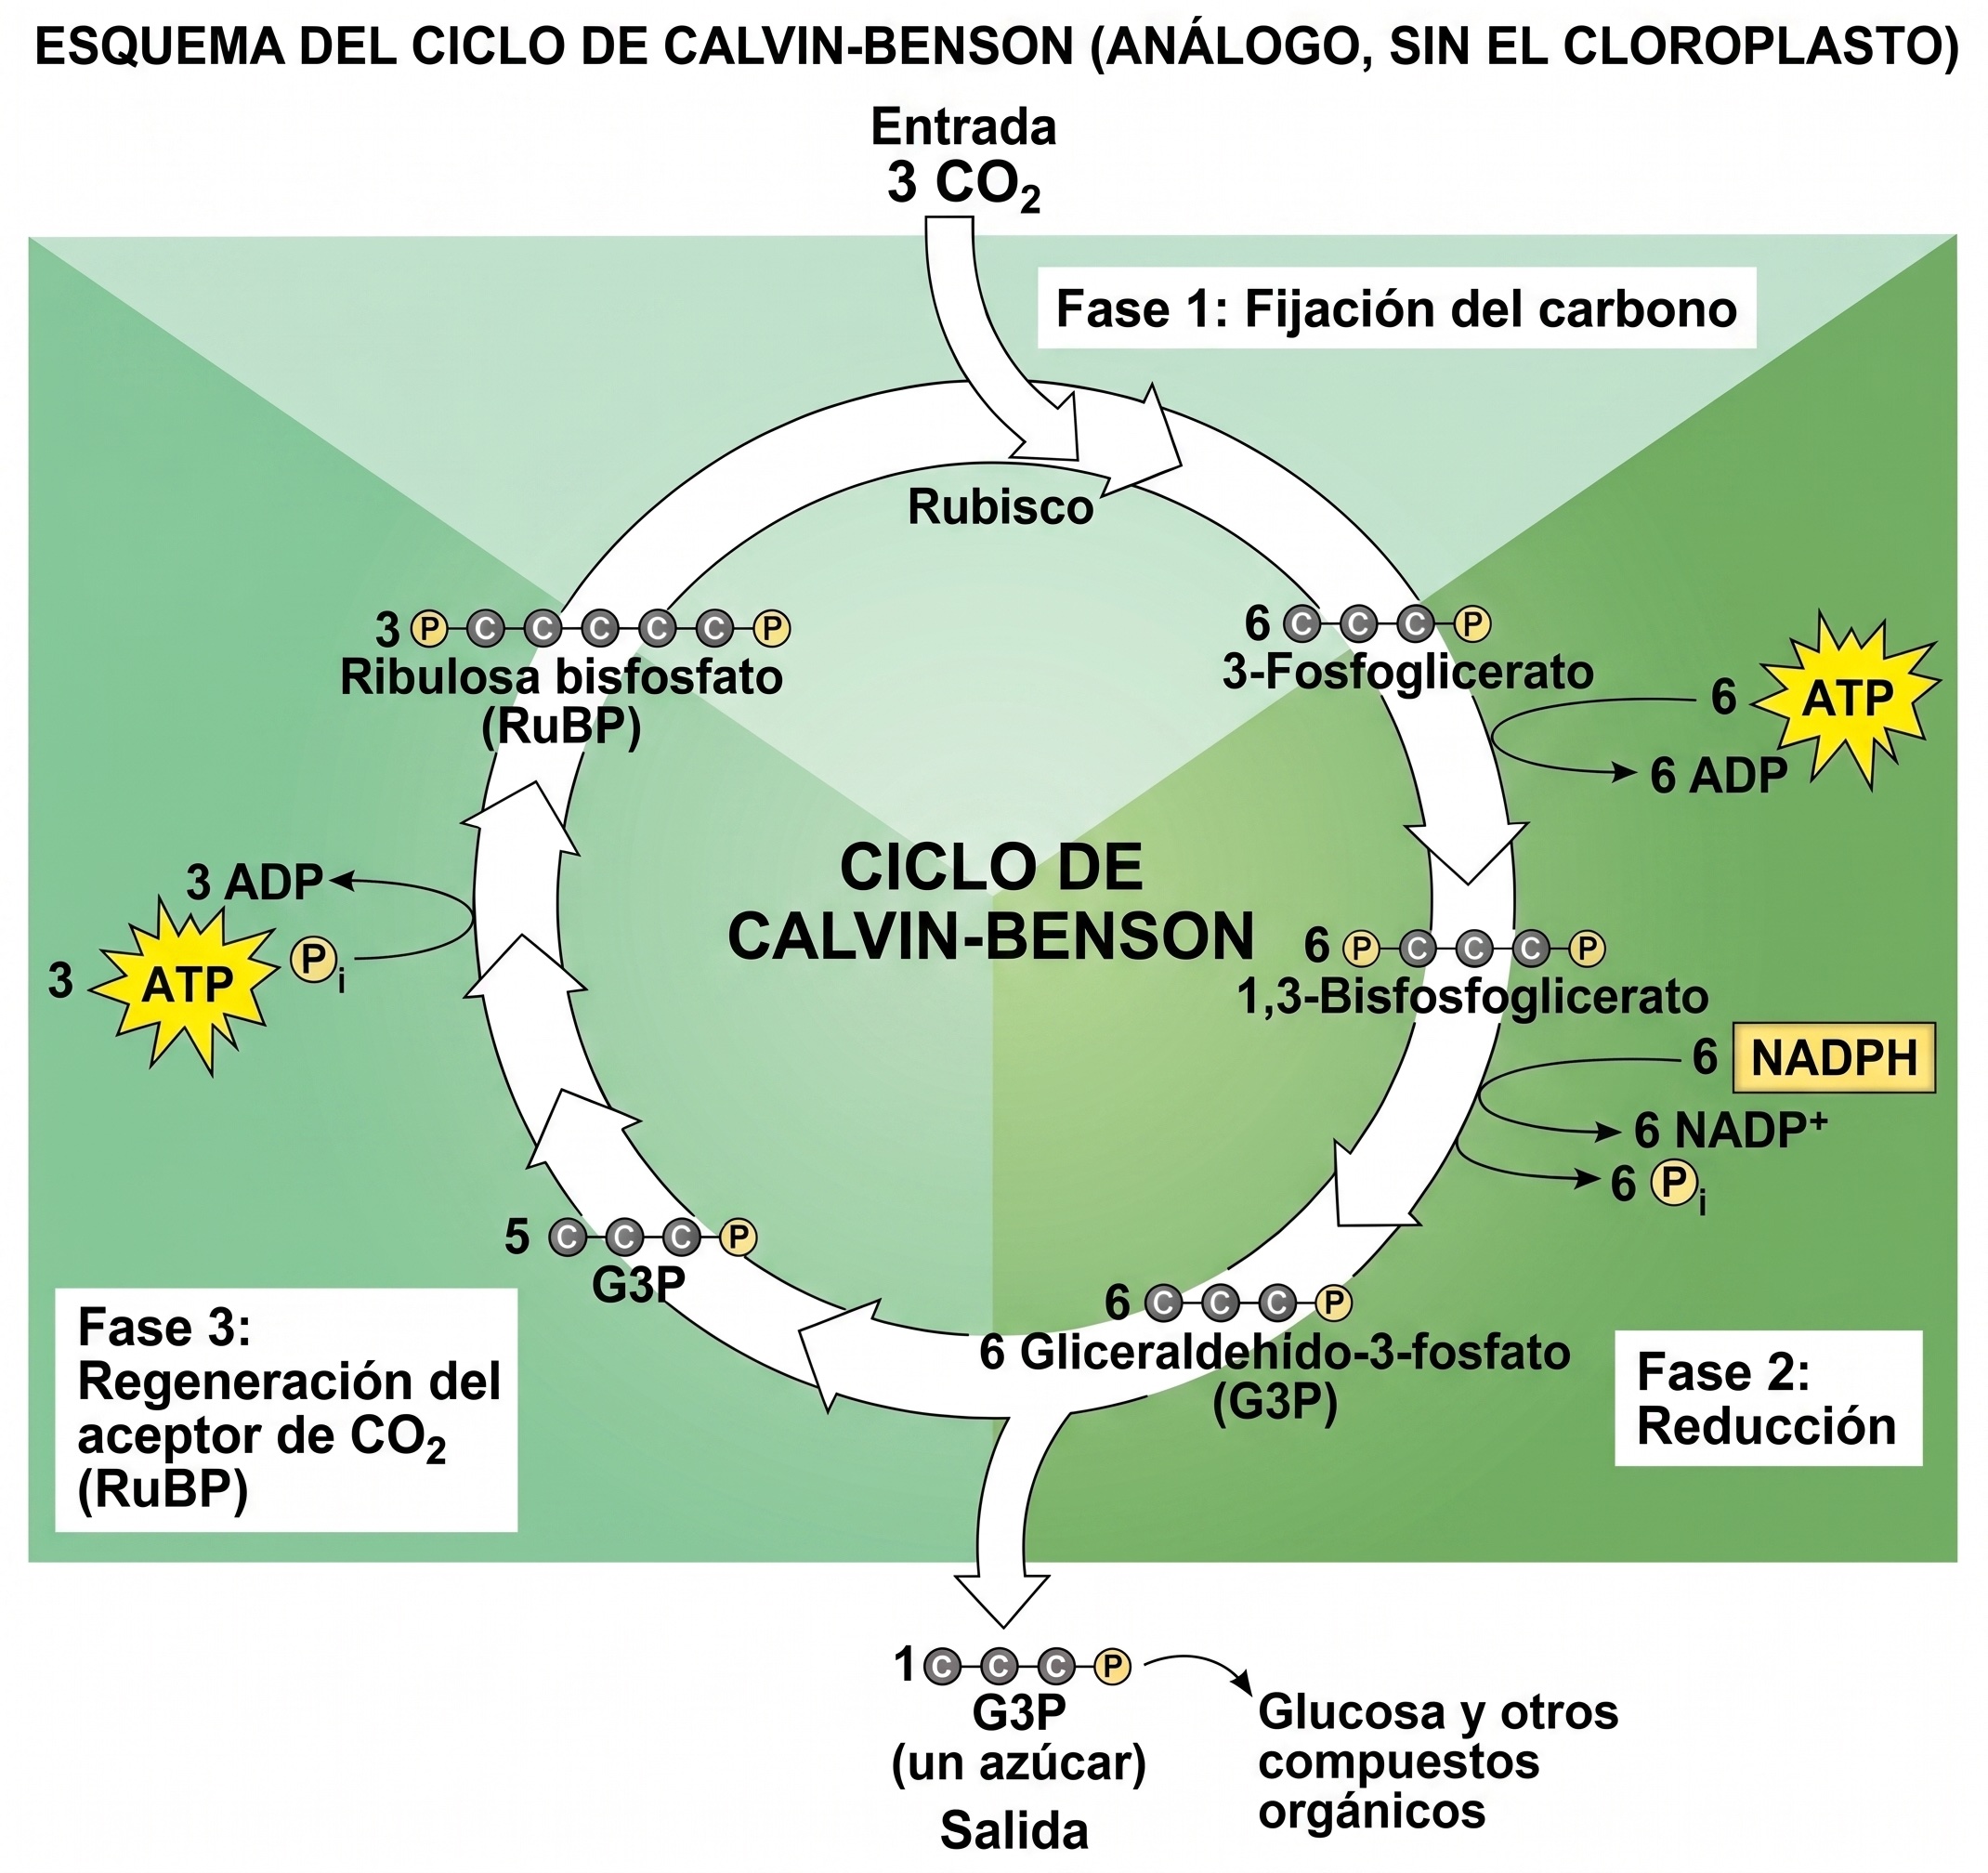
Naturally, RuBP cannot be regenerated from a single G3P. That is why "three turns" of the cycle are shown. In three turns, 6 G3P molecules are formed, of which 5 are used to regenerate three RuBP molecules and one G3P is released as the product of the 3 fixed molecules.
We therefore know that for each fixed, one organic carbon atom is created in the form of biomass. That is, for every 44 g of consumed, 12 g of organic C appear. How much biomass does this represent? It depends on the composition of the biomass. For microalgal biomass, the carbon content is usually around 50% by weight, which in mass fraction (, g carbon/g biomass) is .
Therefore, we can deduce the consumption coefficient of with respect to biomass generation as:
In summary, the stoichiometry of the dark phase of photosynthesis is:
- The basic photosynthesis reaction
Photosynthesis is usually written as the synthesis of glucose from CO2 and water:
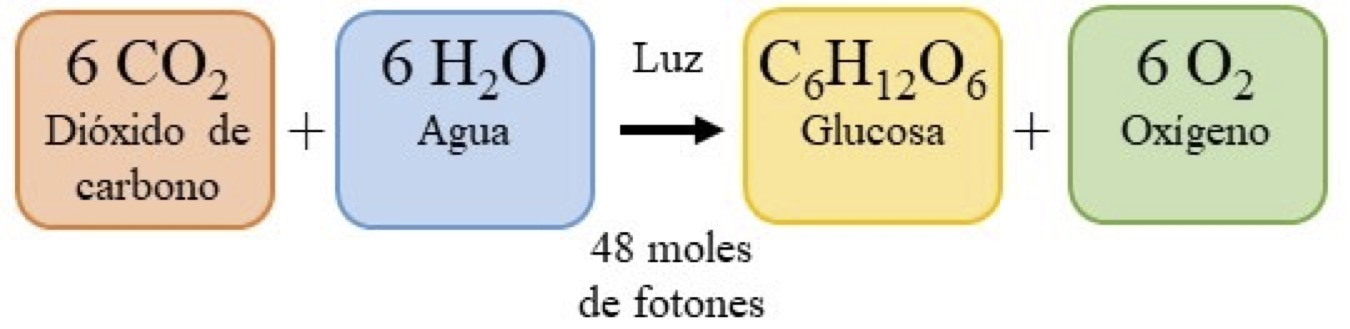
This equation is derived by taking the half-equations of the light phase and the dark phase, adjusting the coefficients so that ATP/ADP and NADPH/NADP⁺ balance, and simplifying:
For our engineering purposes, it is more useful to simplify the equation to the form:
where C(H2O) represents the fixation of one inorganic carbon atom in organic form. This equation oversimplifies the stoichiometry from a biochemical point of view, but maintains the proportions with maximum simplicity, which is what we need from an engineering perspective.
This equation directly relates the fixation of one mole of CO2 to the release of one mole of O2 and the incorporation of one organic carbon atom into the biomass.
However, this equation is only valid when the dark phase consumes all the ATP and all the NADPH produced by the light phase. In that case, exactly 8 moles of PAR photons are required per mole of carbon incorporated into the biomass, and exactly 1 mole of O2 is released per mole of CO2 fixed.
With this information we can calculate all the stoichiometric consumption and yield coefficients needed for photobioreactor design.
However, other anabolic processes can alter this stoichiometry. These deviations must be taken into account when calculating the coefficients.
Processes that alter the simplified stoichiometry
In reality, ATP and NADPH are not used exclusively for CO2 fixation. There are at least three situations that modify the stoichiometric coefficients:
- Nitrogen reduction: when the source is nitrate , its reduction to amine consumes 4 additional moles of NADPH per mole of N fixed.
- Sulphur reduction: sulphate (S+6) is reduced to thiol (S−2) with a similar consumption of reducing equivalents.
- Synthesis of more reduced biomass: lipids have a higher degree of reduction than sugars and carbohydrates, and their synthesis consumes more NADPH per carbon atom.
To account for the effect of these other reactions on photosynthesis stoichiometry, it is necessary to know the composition of the microalgal biomass.
- Composition of microalgal biomass
The biomass composition for which we are designing the PBR is usually known. The variables we will use are the mass fractions of carbon , nitrogen , sulphur and phosphorus , which are the major elements (apart from hydrogen and oxygen , which do not influence the calculation).
These variables and their typical values (which are the ones we will use in the examples) are summarised in the following table:
| Parameter | Symbol | Typical value | Units |
|---|---|---|---|
| C mass fraction | 0.50 | g C / g biomass | |
| N mass fraction | 0.05 | g N / g biomass | |
| S mass fraction | 0.006 | g S / g biomass | |
| P mass fraction | 0.015 | g P / g biomass | |
| Degree of reduction (HC/prot.) | 4.0 | eq e⁻ / mol C | |
| Degree of reduction (lipids) | ~5.7 | eq e⁻ / mol C |
The degree of reduction has also been included, as it is important for stoichiometry. The degree of reduction corresponding to carbohydrates , which would correspond to very lean biomass, and to lipids/fats , which would correspond to very fatty biomass, have been included. Knowing the lipid content of the biomass allows us to estimate its (which will lie between 4.0 and 5.7).
The following table shows compositional data for some microalgae and cyanobacteria species:
| Species | Type | Carbon (C) | Nitrogen (N) | Sulphur (S) | Phosphorus (P) | Ash |
|---|---|---|---|---|---|---|
| Redfield ratio | Reference | 0.458 | 0.083 | --- | 0.009 | --- |
| Chlorella vulgaris | Microalga | 0.485 | 0.082 | 0.005 | 0.011 | 0.060 |
| Scenedesmus obliquus | Microalga | 0.501 | 0.085 | 0.004 | 0.010 | 0.055 |
| Nannochloropsis oculata | Microalga | 0.520 | 0.078 | 0.006 | 0.009 | 0.080 |
| Arthrospira platensis | Cyanobacterium | 0.443 | 0.115 | 0.006 | 0.012 | 0.075 |
| Synechocystis sp. | Cyanobacterium | 0.514 | 0.113 | 0.005 | 0.010 | 0.050 |
| Anabaena sp. | Cyanobacterium | 0.446 | 0.077 | 0.003 | 0.009 | 0.085 |
| Dunaliella salina | Microalga | 0.521 | 0.062 | 0.005 | 0.008 | 0.120 |
Compositions are given as mass fractions (). Note that an ash column is included at the end, expressing the content of other elements such as calcium, sodium, potassium, magnesium and trace metals (zinc, copper, cobalt, etc.).
Molecular formula
Biomass composition data are often available in the form of a fictitious "molecular formula" with an appearance similar to the following:
The has been included for clarity, but it normally does not appear; instead, one has something like . This formula cannot be used directly in our equations. It must first be converted to mass fractions. The meaning of these "formulas" is:
- a moles of per mole of
- b moles of per mole of
- c moles of per mole of
- ... etc.
Thus, to obtain we must perform the following calculation:
Where 12, 1, 16, 32 and 31 are the atomic weights of carbon, hydrogen, oxygen, sulphur and phosphorus. This gives the of each element corresponding to the ash-free biomass composition. To obtain the real composition, the ash content must be known and the correction applied.
You can use the following calculator to obtain mass fractions from the molecular formula:
Calculadora de Composición de Biomasa
With these data, we have everything needed to calculate the consumption and yield coefficients .

- Consumption and yield coefficients
The consumption and yield coefficients condense all the stoichiometric information needed for the design of bioreactors (BRs) and photobioreactors (PBRs).
We will denote these coefficients with the Greek capital letter psi . This letter will be accompanied by subscripts of the form , where:
- x is the amount of substance x consumed or produced with respect to:
- y is the amount of reference substance consumed or produced.
EXAMPLE: : represents the amount of consumed with respect to the amount of biomass generated.
-
Amounts can be given in moles or in mass, even mixed. In PBR design we will restrict ourselves to using coefficients on a mass basis, since it is often not straightforward to assign a "molecular weight" to biomass even when we have the pseudoformula .
-
Therefore, means that 1.833 g of are consumed per gram of biomass generated.
Basic stoichiometric coefficients
The stoichiometric consumption and production coefficients for O₂, CO₂ and biomass most commonly encountered, assuming that the Calvin-Benson cycle consumes all the resources produced by the light phase of photosynthesis and accepting that biomass contains 50% carbon by weight , are as follows:
-
Oxygen generation:
-
consumption:
-
Photon consumption:
-
The inverse of the "photon consumption" is also commonly used: , known as the "quantum yield".
We have used to represent biomass so that the notation is more compact. Photons must be expressed in moles, since they have no (rest) mass.
Correction for nitrogen and sulphur reduction
When an oxidised nitrogen source (such as ) and sulphur as sulphate () are used. Phosphorus content does not influence the result because phosphorus does not change oxidation state.
-
For oxygen:
-
For photons:
-
is not affected because this process occurs exclusively in the dark phase of photosynthesis.
Correction for biomass reduction (increase in degree of reduction)
The degree of reduction of photosynthesis products is approximately 4 . When biomass is more reduced, for example due to a higher lipid content, the degree of reduction increases. For biomass rich in lipids or other reduced substances (), additional reducing factors (ATP and NADPH) from the light phase of photosynthesis are consumed, increasing the generation of per gram of biomass.
The degree of reduction can be incorporated into the stoichiometry using the following equation:
This allows the stoichiometric coefficient for oxygen generation relative to biomass generation (g of generated per gram of biomass generated) to be calculated across a very wide range of circumstances and processes.
The following interactive component allows , and to be calculated as a function of biomass composition and nitrogen source.
Calculadora de Coeficientes Estequiométricos

- Practical examples
-
Let us find out how much is needed to produce 100 kg of Chlorella and how much will be released if the nitrogen source is sodium nitrate.
-
How much biomass can be produced with a 35 kg cylinder of ? How much is released? How much water is consumed? Assume that the nitrogen source is ammonium chloride.
-
In a photobioreactor, 2.6 kg of are released per day. How much biomass is produced? How much is consumed? Perform the calculation for both nitrogen sources.
In all cases, , , and .
- Summary
Photosynthesis is a quantum process requiring 8 PAR photons to fix one carbon atom. The light phase generates ATP, NADPH and from , while the dark phase (Calvin-Benson cycle) fixes consuming those energy resources.
The simplified engineering equation is: CO₂ + H₂O + 8 photons → C(H₂O) + O₂
The stoichiometric coefficients () relate consumptions and productions to the biomass generated. These coefficients depend on:
- The elemental composition of the biomass (mass fractions , , )
- The nitrogen source ( requires more reduction than )
- The degree of reduction (higher in lipid-rich biomass)
The key coefficients are: (CO₂ consumption), (O₂ generation) and (photon consumption), which are essential for the rational design of photobioreactors.
Questions and problems
Question 1 - What is the value of when the nitrogen source is potassium nitrate?
Question 2 - What is the value of when the nitrogen source is potassium nitrate?